Conditioning plots of survey data
svycoplot.RdDraws conditioned scatterplots ('Trellis' plots) of survey data using hexagonal binning or transparency.
Arguments
- formula
A graph formula suitable for
xyplot- design
A survey design object
- style
Hexagonal binning or transparent color?
- basecol
The fully opaque 'base' color for creating transparent colors. This may also be a function; see
svyplotfor details- alpha
Minimum and maximum opacity
- hexscale
Scale hexagons separate for each panel (relative) or across all panels (absolute)
- ...
Other arguments passed to
grid.hexagonsorxyplot
Value
An object of class trellis
Note
As with all 'Trellis' graphs, this function creates an object but does
not draw the graph. When used inside a function or non-interactively
you need to print() the result to create the graph.
See also
Examples
data(api)
dclus2<-svydesign(id=~dnum+snum, weights=~pw,
data=apiclus2, fpc=~fpc1+fpc2)
svycoplot(api00~api99|sch.wide*comp.imp, design=dclus2, style="hexbin")
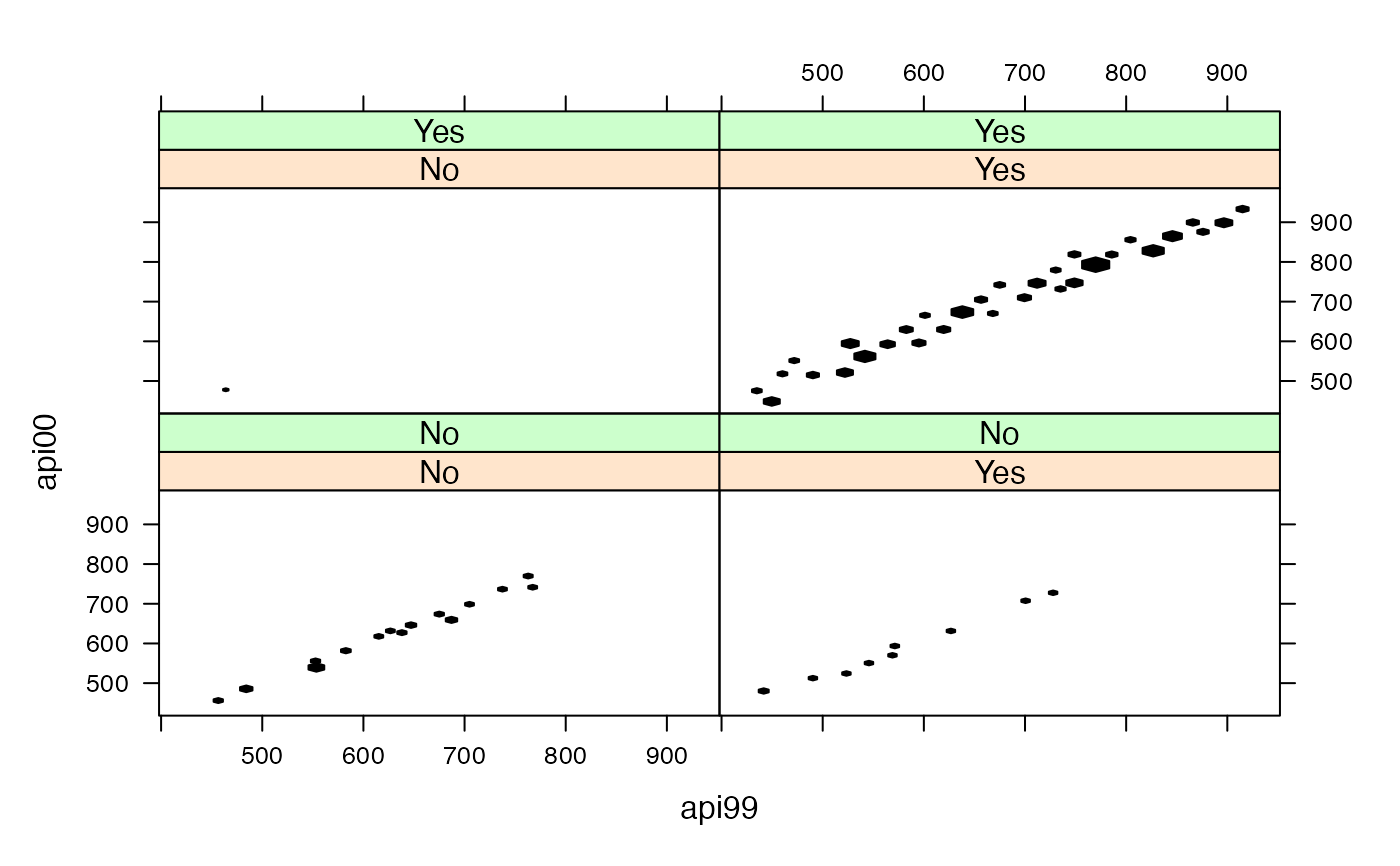
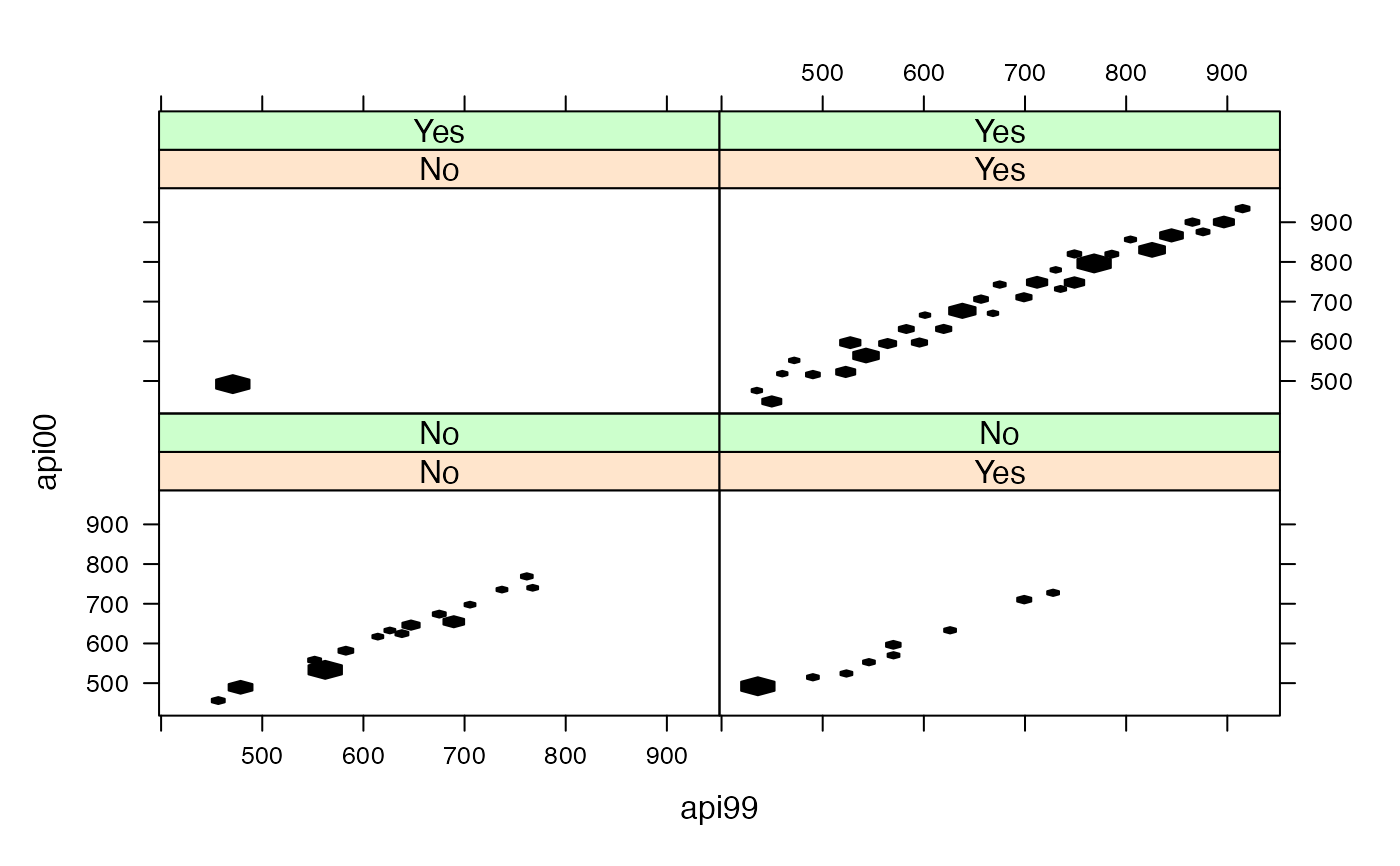 svycoplot(api00~api99|sch.wide*comp.imp, design=dclus2, style="hexbin", hexscale="absolute")
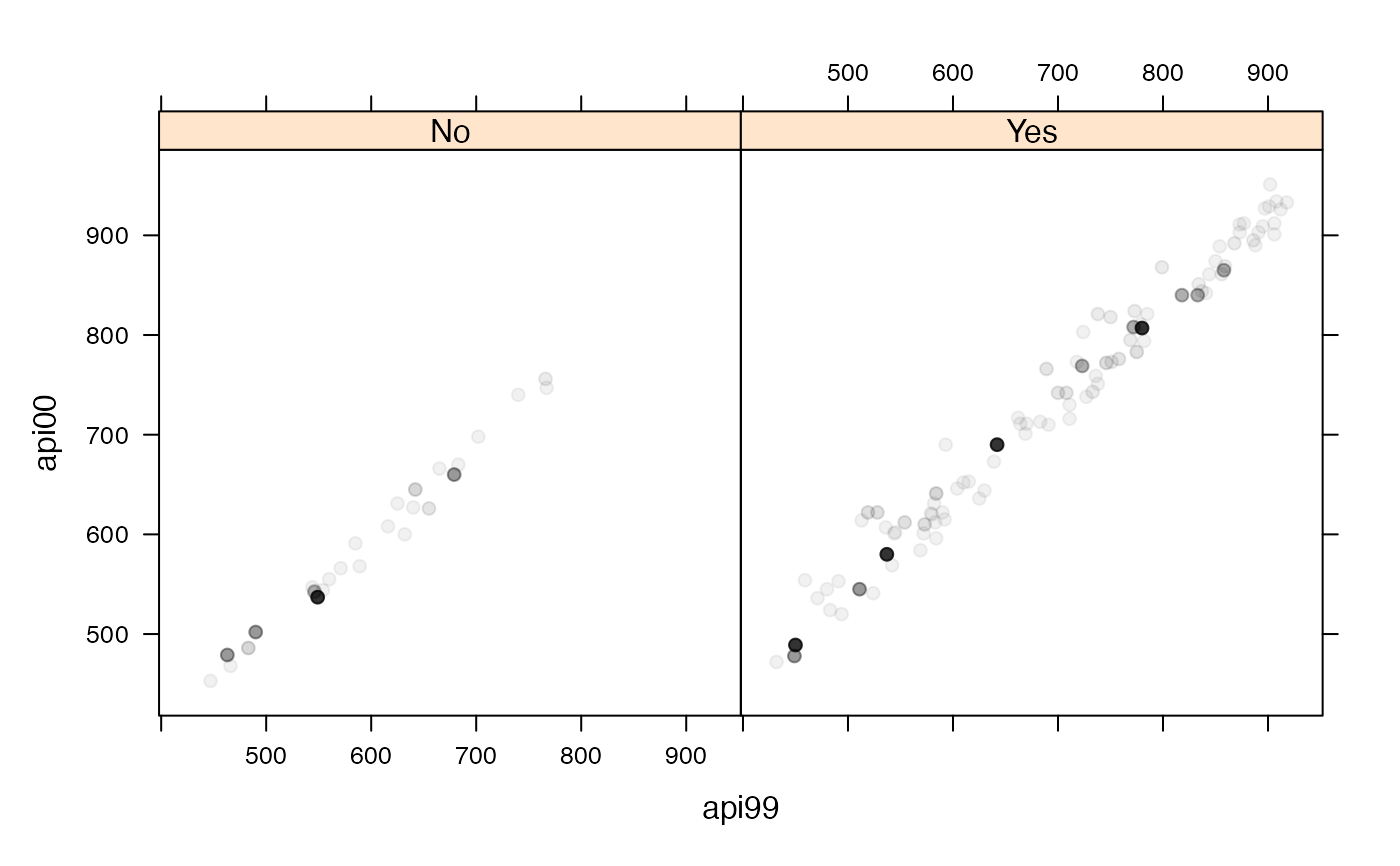
 svycoplot(api00~api99|sch.wide, design=dclus2, style="trans")
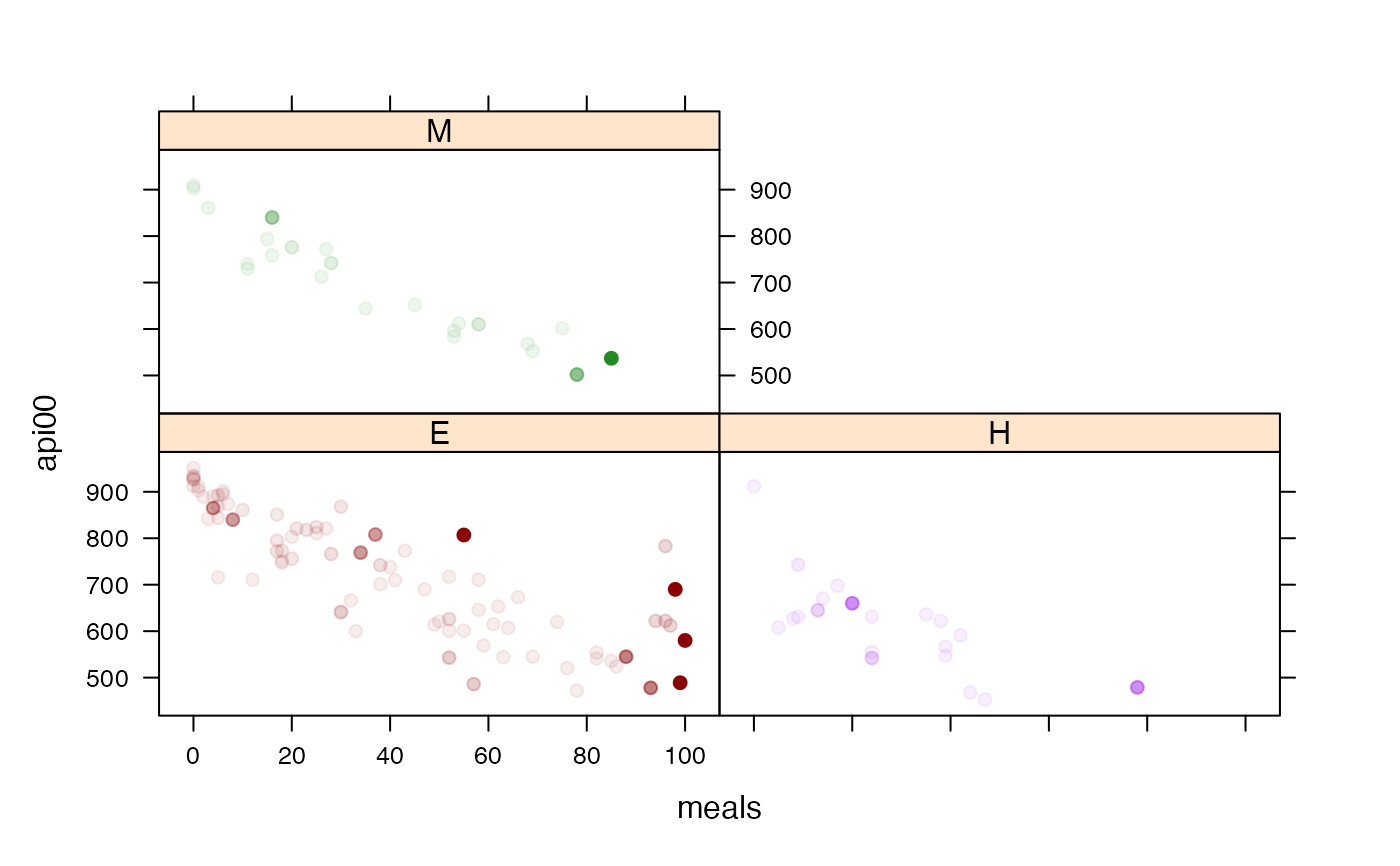
 svycoplot(api00~meals|stype,design=dclus2,
style="transparent",
basecol=function(d) c("darkred","purple","forestgreen")[as.numeric(d$stype)],
alpha=c(0,1))
svycoplot(api00~meals|stype,design=dclus2,
style="transparent",
basecol=function(d) c("darkred","purple","forestgreen")[as.numeric(d$stype)],
alpha=c(0,1))